Data project

Where New York's ride-hail riders wait too long, and where a fixed budget should go

20.5 million Uber and Lyft trips from one month in New York, used to decide where a fixed driver-incentive budget would cut the most long waits.

Reading time
7 min
Last updated
Domain
Mobility
Tools
SQLPythonpandasmatplotlib

The question

With a fixed budget for driver incentives, where and when should it be spent to cut the most long waits?

The answer

Concentrate the budget on the tenth of the city's zone-hours that produce 44% of long waits, led by late nights and weekday-evening airport pickups, and spend it on drivers being there rather than on the rides themselves. Prove it on half of those zone-hours for four weeks before scaling.

of rides wait more than 10 minutes: 2.5 million in one month
12%of rides wait more than 10 minutes: 2.5 million in one month
of a long wait is the driver still on the way
92%of a long wait is the driver still on the way
of long waits fall in 10% of the city's zone-hours
44%of long waits fall in 10% of the city's zone-hours

Scenario

Where and when to spend a fixed monthly driver-incentive budget

Hypothetical scenarioPublic data, framed as a real kind of decision. Not work for a client.

Organisation
A ride-hail marketplace team in New York City
Stakeholder
Head of Marketplace Operations
Decision
Where and when to spend a fixed monthly driver-incentive budget
What's at stake
Spread evenly, the budget pays for rides that were never at risk. Aimed badly, riders keep waiting in the places and hours where they already wait longest.

The data

Where the numbers come from

Sources

Every trip completed by Uber and Lyft in New York City in June 2026, 20.8 million of them, published by the Taxi and Limousine Commission. Each one records when the ride was requested, when the driver arrived and when the rider got in, so a wait can be measured and split into its parts. A long wait here is more than 10 minutes from request to pickup.

Definitions

Long wait
More than 10 minutes from request to pickup.
Zone-hour
One pickup zone at one hour of the day, on weekdays or at weekends: the smallest unit a scheme can realistically be switched on for.

Cleaning notes

After cleaning, 20.5 million remain. The largest exclusion is the 1.3% of trips picked up before they were requested, at almost the same rate for both companies: scheduled rides, whose recorded wait is not a wait.

Findings

What the data shows

Finding 01

Long waits are not a borough problem

Geography is the obvious first cut, and it points nowhere. Brooklyn holds 28% of long waits, Manhattan 28%, Queens 26% and the Bronx 16%. Manhattan, with a third of all rides, holds less than its share.

So whatA scheme drawn by borough would spend most of its money where waits are already fine.
Finding 02

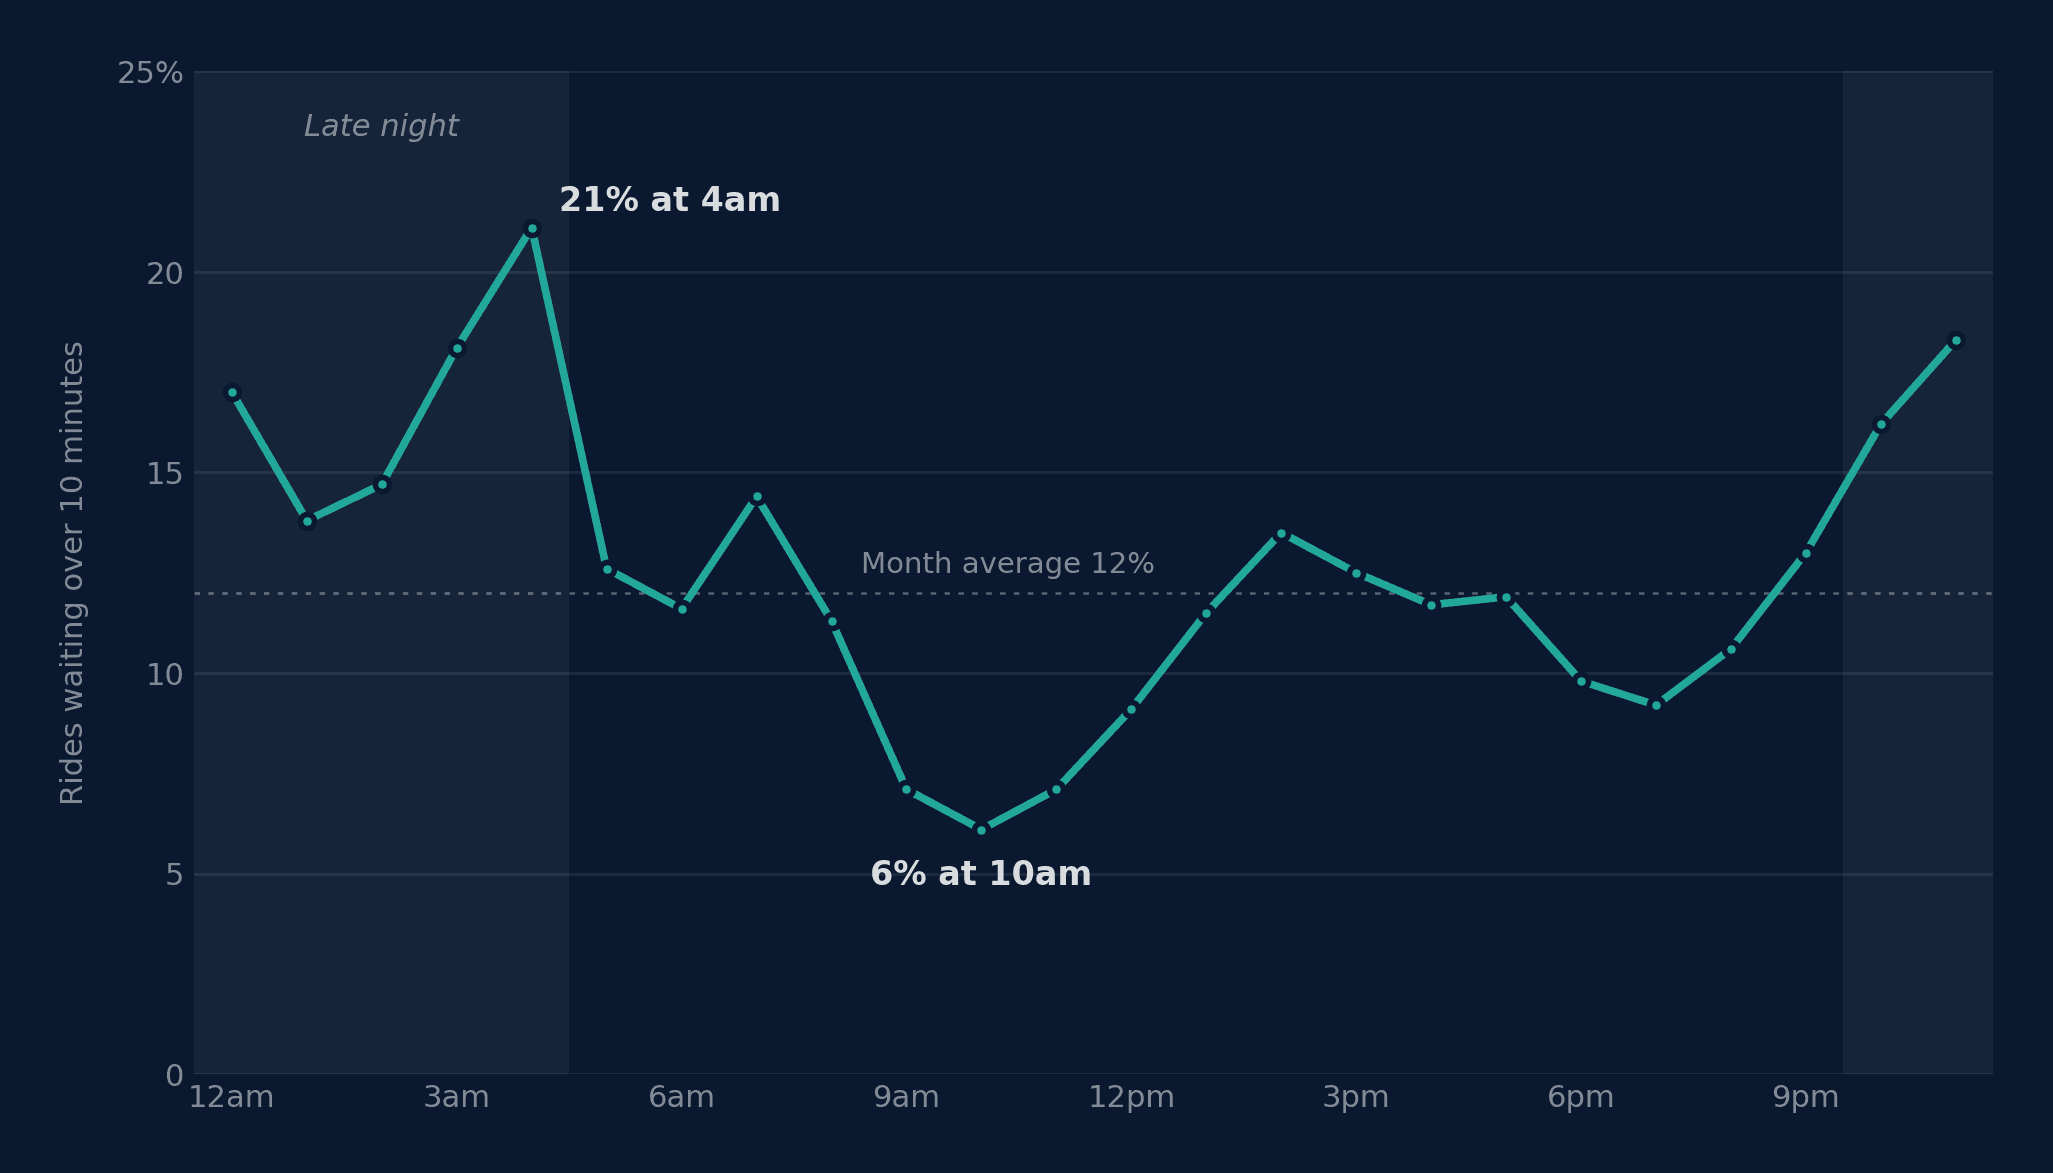
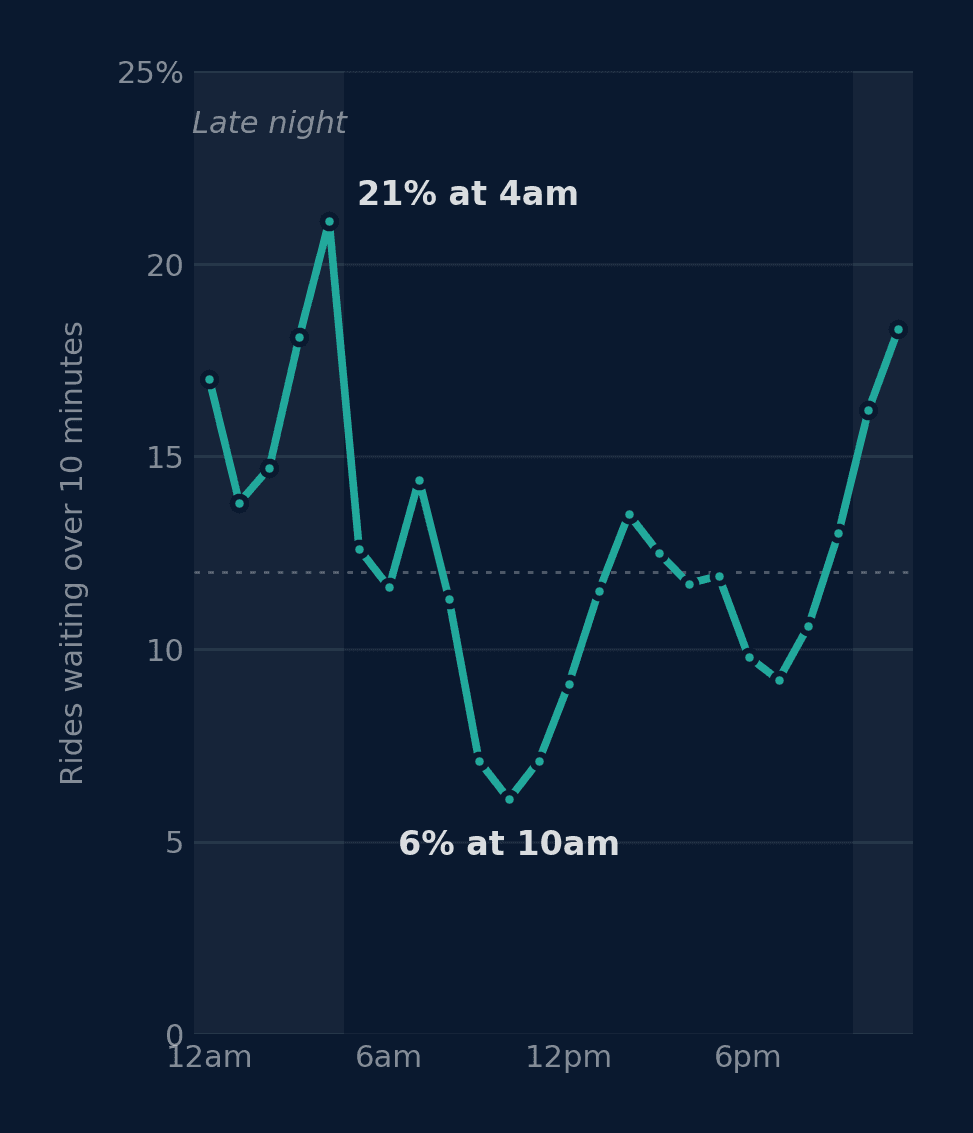
They follow the clock: 21% of rides wait long at 4am, 6% at 10am

The long-wait rate more than triples between mid-morning and the small hours. Late night, from 10pm to 5am, carries 21% of rides and 30% of long waits. Weekday-evening pickups at JFK and LaGuardia are about 1% of rides, but 39% of them wait more than 10 minutes.

Line chart of the share of rides waiting over 10 minutes by hour of day, peaking at 21% at 4am and falling to 6% at 10am, with a month average of 12%.
Share of rides waiting more than 10 minutes, by hour of request, June 2026. Shaded: late night, 10pm to 5am. Dashed: the month average, 12%.

So whatThe problem keeps a schedule, so the budget can follow it instead of running all day.

Finding 03

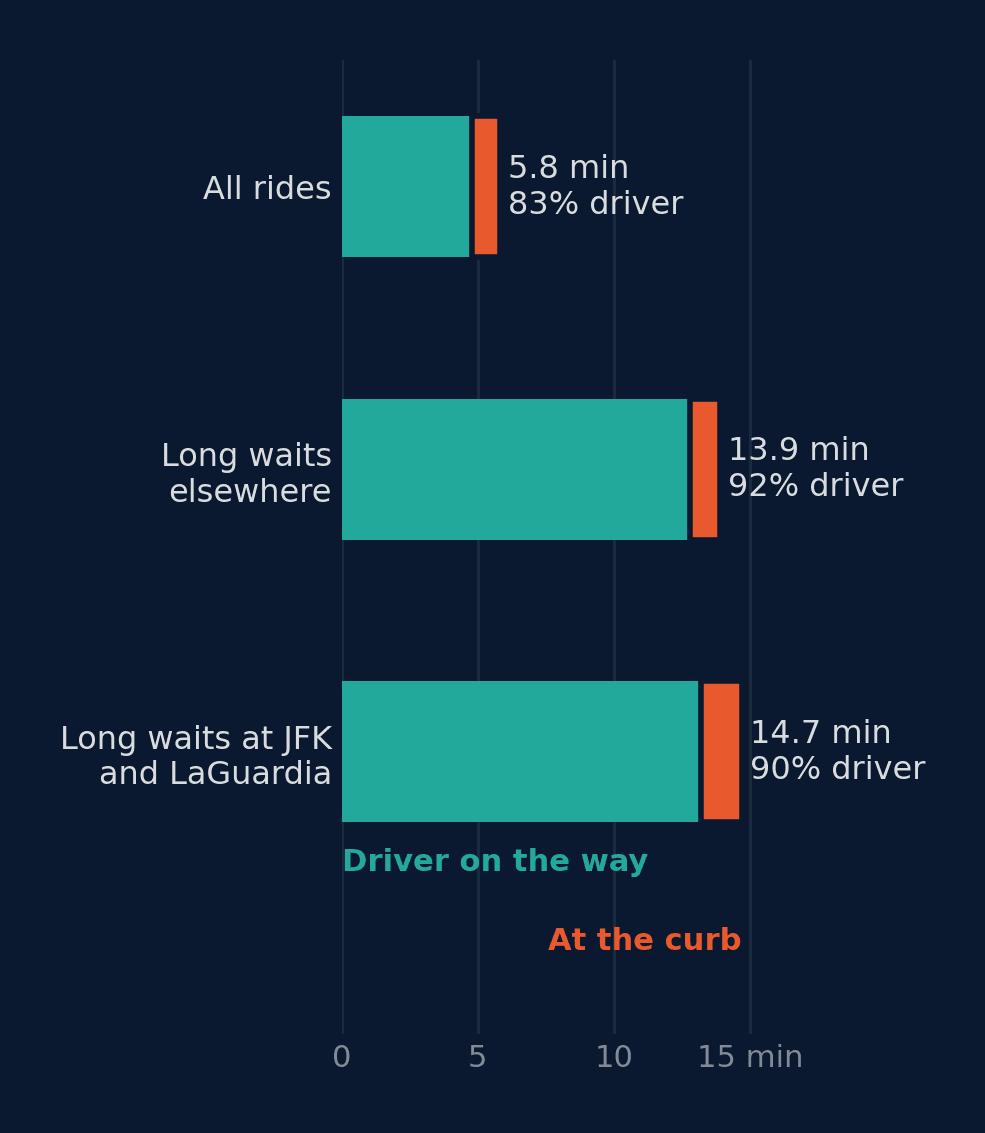
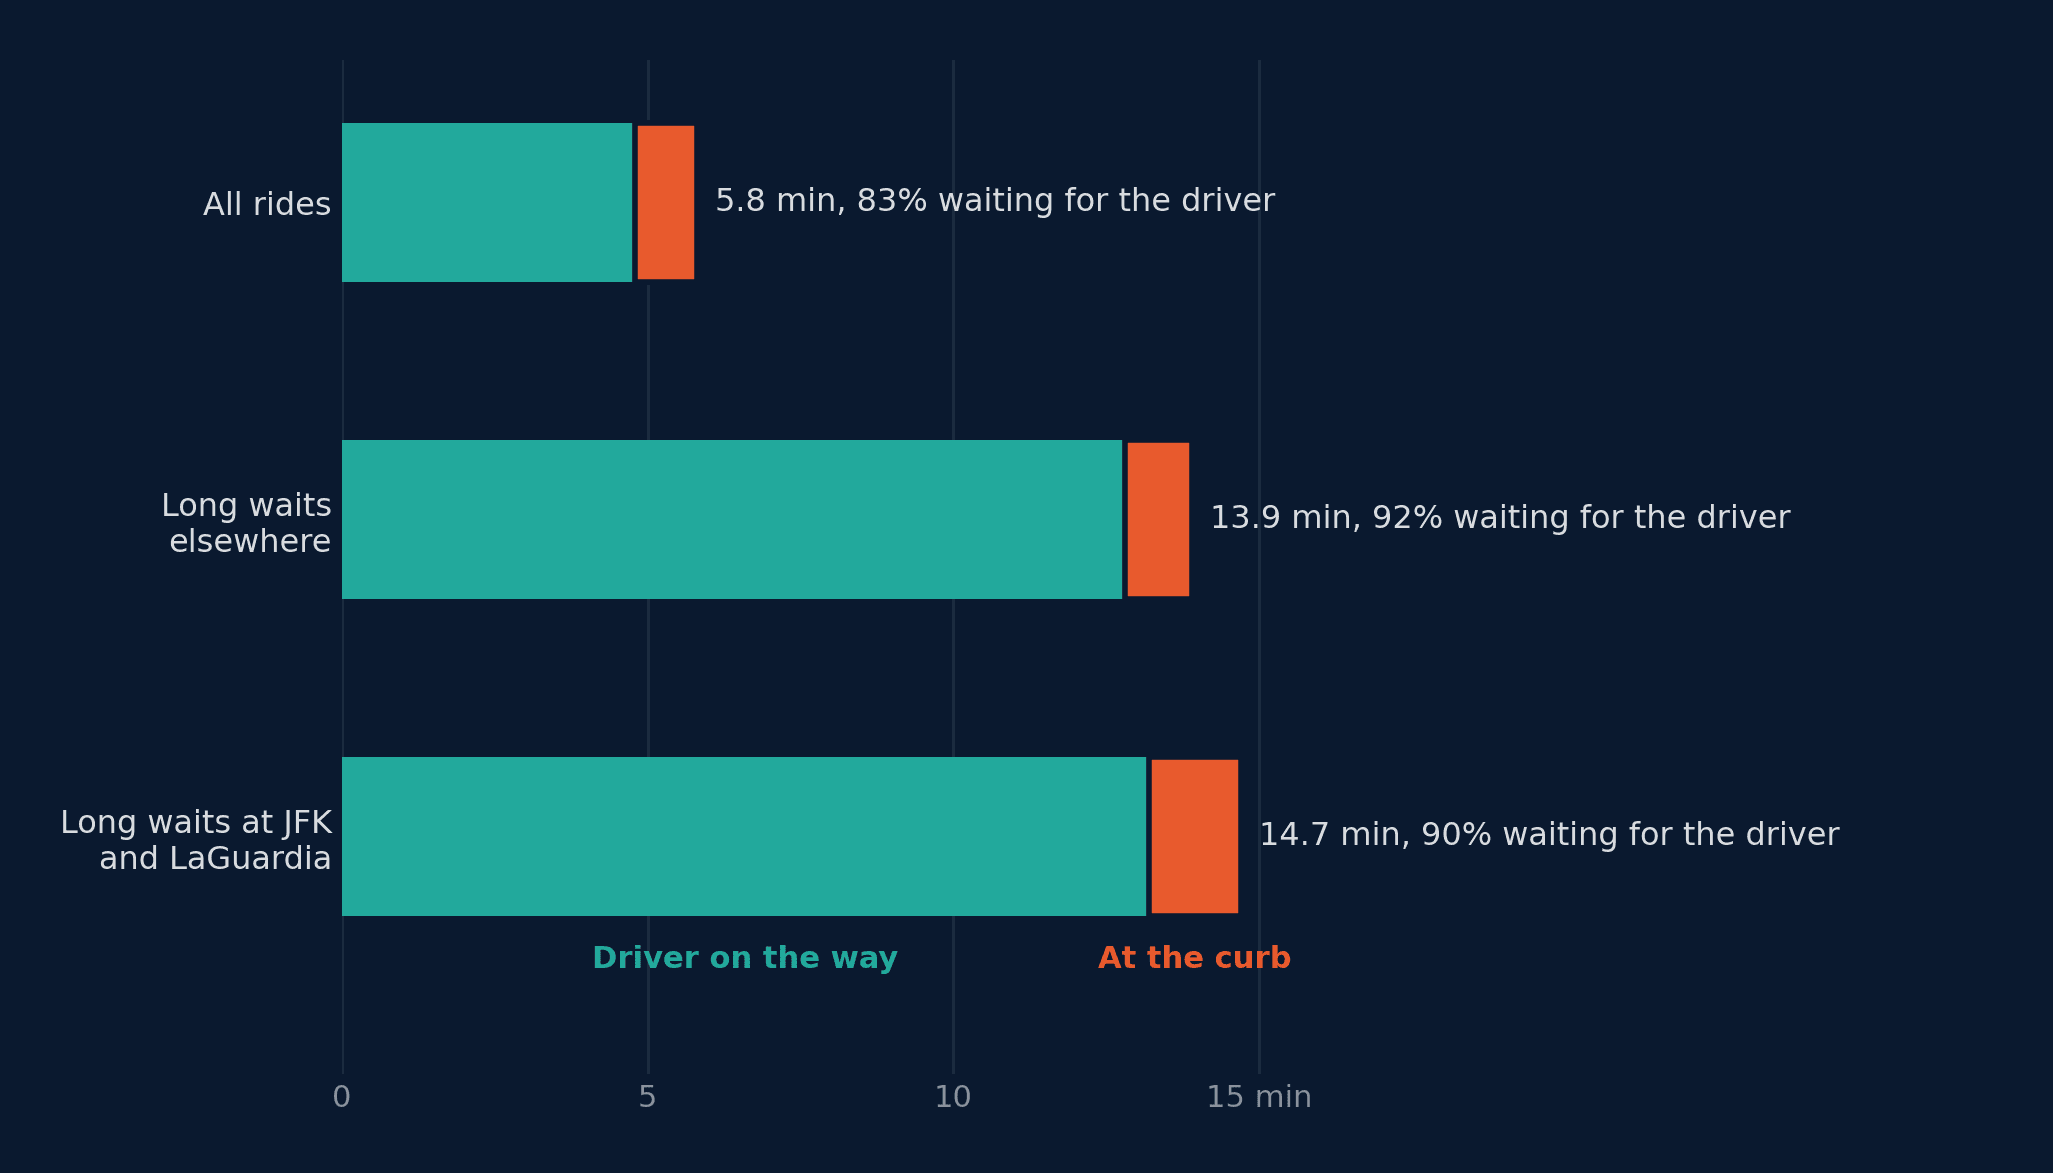
92% of a long wait is the driver still on the way, even at the airports

A wait has two parts: the driver travelling to the pickup, and the two of them finding each other at the curb. They need different fixes. The working assumption was that the airports would be a curb problem: terminals, pickup zones, riders who cannot find the car.

They are not. On a long wait, 12.9 minutes is the driver on the way and 1.2 is at the curb, and at the airports the driver's share is still 90%.

Stacked bar chart splitting average waits into driver travel time and curb time: 5.8 minutes for all rides, 13.9 for long waits in the city and 14.7 for long waits at the airports, with the driver's share between 83% and 92%.
Average minutes of a wait, split into the driver on the way and the pickup at the curb.

So whatBetter signage and pickup points will not fix this. More drivers in the right place at the right hour will.

Finding 04

Drivers are not paid less where the waits are worst

If drivers stayed away because these places pay badly, the answer would be more money per ride. The data says otherwise. Pay per hour of trip time is $65.40 in the worst zone-hours against $63.70 everywhere else, and across zone-hours the long-wait rate rises slightly with pay rather than falling (correlation +0.28).

So whatA bigger per-ride bonus pays for rides that would happen anyway. The scheme should pay for being available, not for the ride.

Finding 05

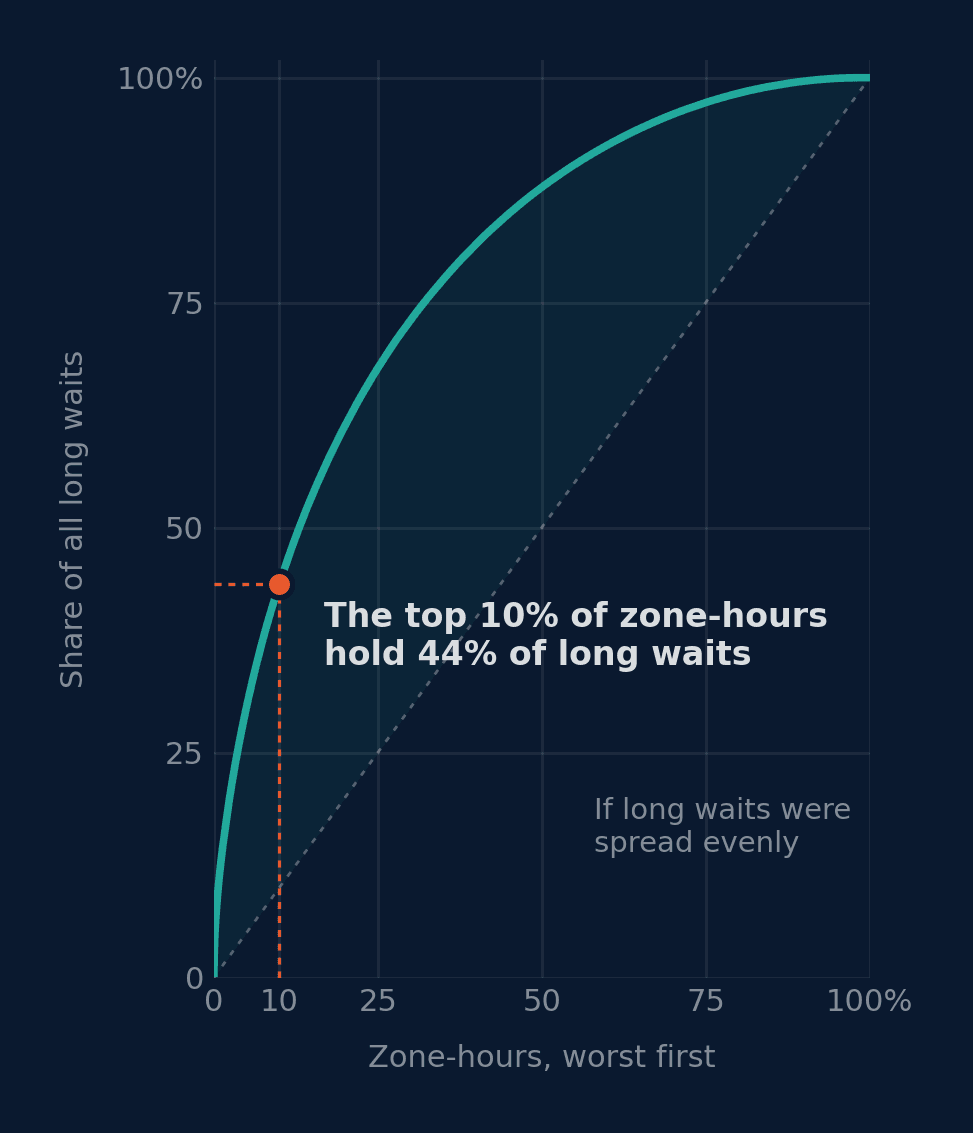
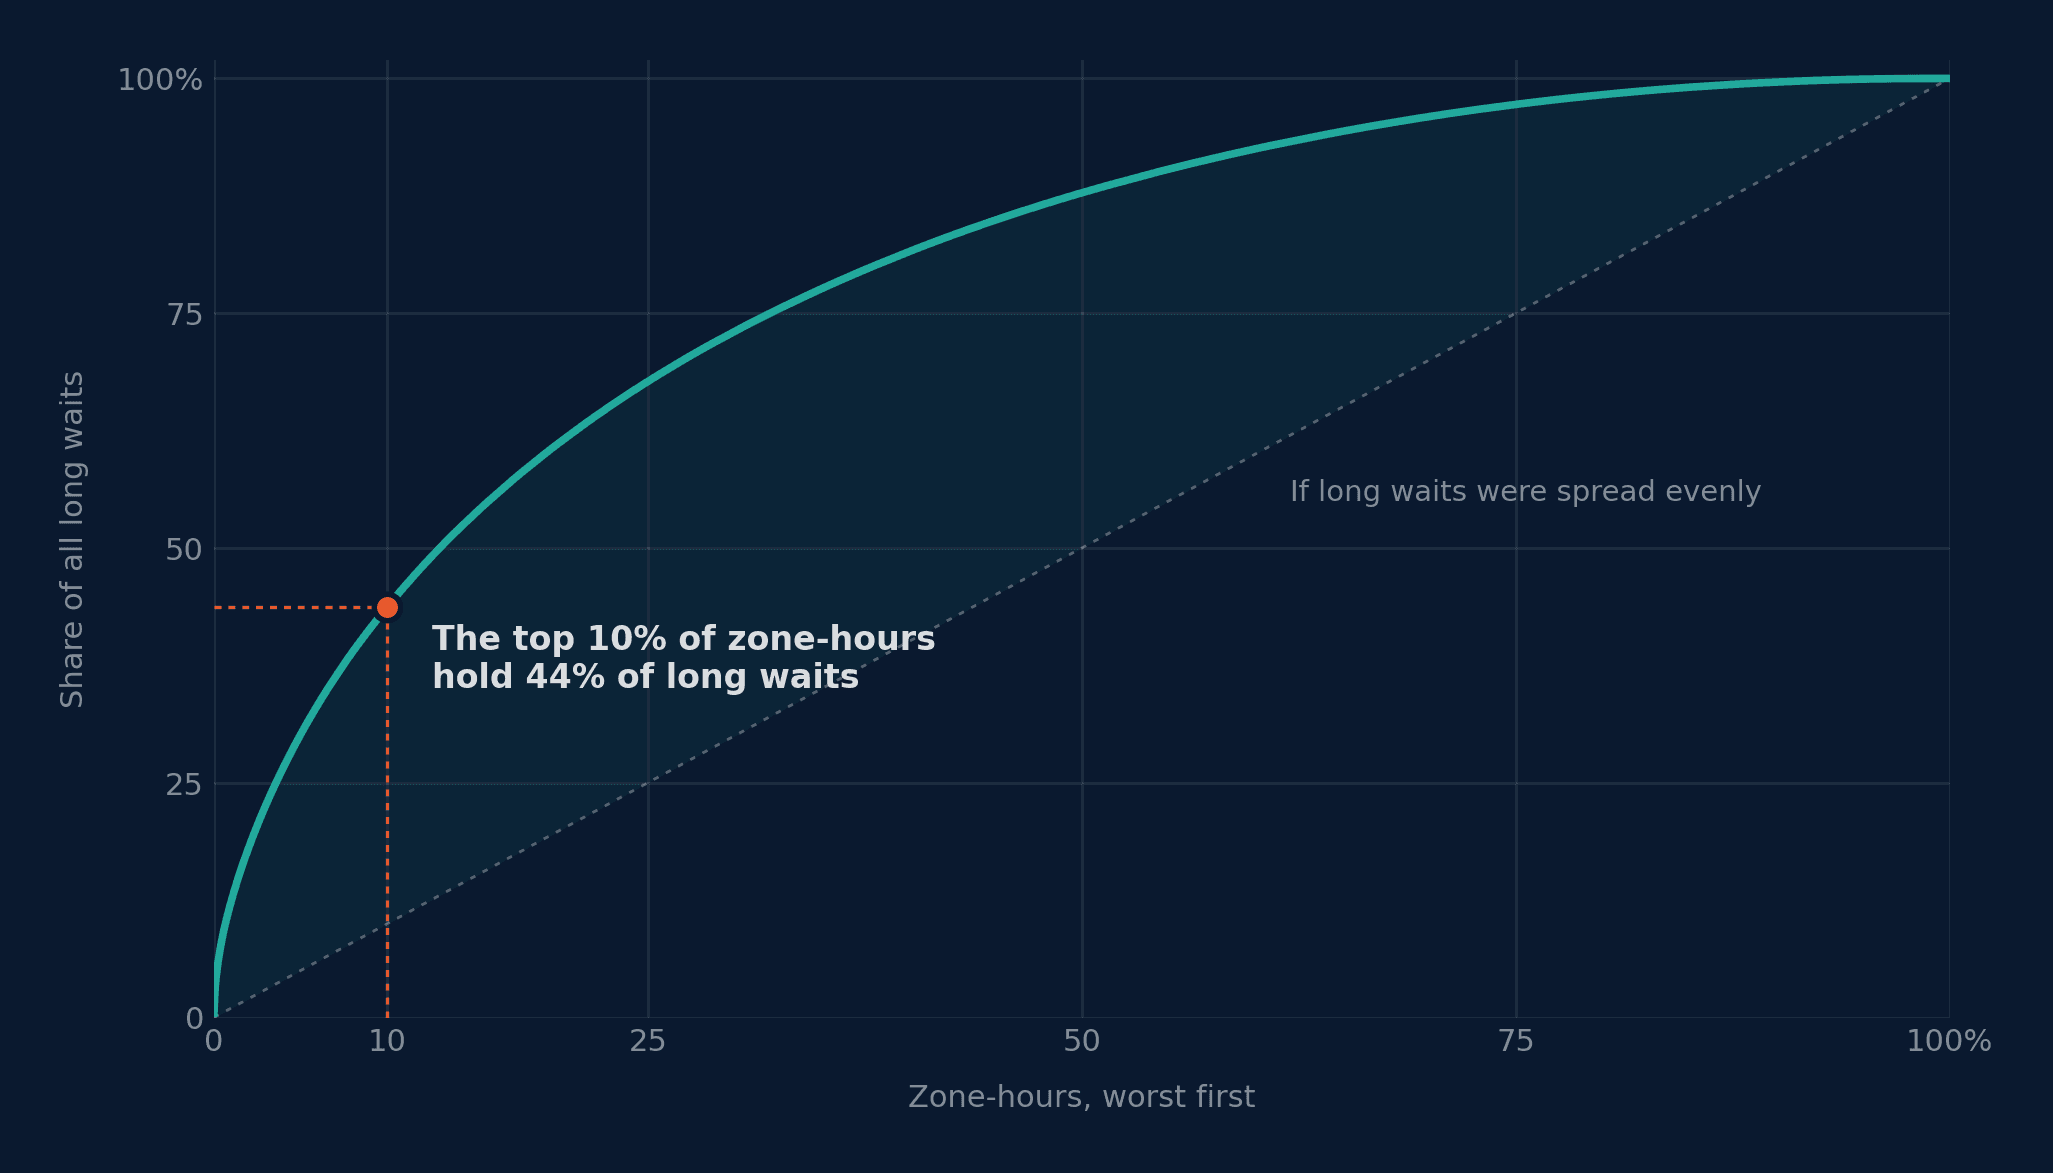
A tenth of the city's zone-hours hold 44% of long waits

A zone-hour is one pickup zone at one hour of the day, on weekdays or at weekends: the smallest unit a scheme can realistically be switched on for. Ranked by how many long waits each produces, the worst 1,235 of 12,356 hold 43.7% of all long waits while carrying 30% of rides.

The result does not depend on where the line is drawn. At 8 or 12 minutes instead of 10, the top tenth holds 41 to 46% of long waits, and 93% of the zone-hours it picks are the same.

Concentration curve rising steeply: the worst 10% of zone-hours account for 44% of all long waits, far above the diagonal an even spread would follow.
Cumulative share of long waits, with zone-hours ranked worst first. The dashed line is what an even spread would look like.

So whatA fixed budget aimed at a tenth of the map and the clock can reach close to half the problem.

Recommendation

Three moves, in order: where to spend, what to pay for, and how to know it worked.

  1. Aim the budget at the top tenth of zone-hours, starting with late nights and weekday-evening airport pickups

    44% of long waits happen in 10% of the places and hours.

    Based on Finding 05
    Impact
    Reaches close to half of all long waits
    Effort
    Low
  2. Pay a guaranteed hourly minimum to drivers online in a target zone-hour, instead of a per-ride bonus

    92% of a long wait is driver supply, and pay there is already slightly higher.

    Based on Finding 03
    Impact
    Moves drivers to the shortage rather than rewarding rides already happening
    Effort
    Medium
  3. Run it for four weeks on a random half of the target zone-hours, with the other half as the comparison

    Nothing in this data measures what an incentive does. The test is what turns a finding into a decision.

    Impact
    A measured cost per long wait avoided, before money is committed at scale
    Effort
    Medium

How it will be measured

Knowing whether it worked

  • Share of rides waiting more than 10 minutes in the target zone-hours, against the comparison half
  • Median time for a driver to arrive
  • Cost of each long wait avoided, the number that decides whether it scales

Limits

What this data cannot say

  • One month, June 2026. Seasonality, holidays and weather are not covered; a second month would show whether the same zone-hours recur.
  • Only completed trips are recorded. Riders who gave up waiting are missing, so the worst waits are undercounted, and most where they are worst.
  • Uber and Lyft are combined. They differ sharply, 13.6% of Uber rides waiting long against 7.7% of Lyft's, possibly because of how each records the request time. This is a view of the market, not of one operator.
  • No incentive exists in the data, so the size of its effect is not estimated here. That is what the test is for.
  • Pay per trip-hour leaves out time spent driving to a pickup or waiting for one, which the data does not record.
  • Taxi zones are coarse. A real scheme would target finer areas using the operator's own location data.
  • 10 minutes is a judgement. The ranking was rerun at 8 and 12 minutes and holds.

Method

How it was done

SQL over the Taxi and Limousine Commission's public trip records: six files, one per question, from cleaning to the sensitivity test. Python for the charts and a narrative notebook.

ValidationA validation script checks the pipeline's tables against each other, recounts the headline straight from the raw file, and compares every figure on this page with the data. All 51 checks pass.

Role and next steps

Taking it from analysis to a decision

My role

Solo, end to end: framing the decision, the data pipeline, the analysis and the recommendation.

Stakeholders

Marketplace Operations
Own the budget and the decision
Driver Operations
Would design and explain the hourly minimum
Finance
Would sign off the cost per long wait avoided

Next steps

  1. 01Repeat the analysis on two more months to confirm the same zone-hours recur
  2. 02Agree the success measure and the stopping rule with Finance before the test starts
  3. 03Run the four-week test
  4. 04Scale, adjust or stop on the cost per long wait avoided

Have something worth discussing?

Get in Touch